

Quick answer
Most privately held businesses are valued as a multiple of earnings, and the metric depends on size. Owner-operated small businesses are valued on seller's discretionary earnings (SDE) and typically transact between 2x and 4x, while larger management-run companies are valued on EBITDA and typically transact between 4x and 9x, rising with deal size. Software, insurance brokerage, wealth management, and essential recurring-service businesses sit at the top of those ranges; restaurants, physical retail, and project-based construction sit at the bottom.
This reference gives the working ranges by industry, by earnings metric, and by deal size, then explains what moves a specific business inside its range and where the underlying data comes from.
What is a valuation multiple?
A valuation multiple is the ratio between the price paid for a business and one of its financial measures, most often a normalized annual earnings figure. If a business generates $800,000 of adjusted EBITDA and sells for $4,000,000, it traded at a 5.0x EBITDA multiple.
Multiples are shorthand for everything a buyer believes about a business at once: how durable the earnings are, how fast they will grow, how much capital they consume, and how much risk sits in the customer list. A 3x business and an 8x business are not being valued by different math. They are being told different things about the reliability of their cash flow.
Three metrics carry almost all small and mid-market deal volume:
| Metric | What it measures | Typical use | Business size |
|---|---|---|---|
| SDE | Pre-tax earnings plus one owner's total compensation, perks, and non-recurring items | Owner-operated businesses where the buyer will replace the owner | Under roughly $1M of earnings |
| EBITDA | Earnings before interest, tax, depreciation, and amortization, after market-rate management pay | Businesses run by salaried management | Roughly $1M of earnings and above |
| Revenue | Top-line sales, sometimes recurring revenue or ARR specifically | Sectors with tightly clustered margins, or unprofitable growth businesses | Any, as a cross-check |
The dividing line between SDE and EBITDA is not a rule so much as a convention, and there is a genuine grey zone between roughly $750,000 and $1.5M of earnings where both get quoted. Our full breakdown of the two metrics lives in SDE vs EBITDA: which metric matters.
SDE multiples by industry for owner-operated businesses
These ranges apply to businesses where a single working owner is central to operations and earnings are stated as SDE after legitimate add-backs. They assume clean, verifiable financials and a transferable customer base. Treat them as a starting point for negotiation, not an appraisal.
| Industry | Typical SDE multiple | Notes |
|---|---|---|
| HVAC, plumbing, electrical | 2.5x - 4.5x | Service agreements and licensed technicians push toward the top |
| Landscaping and grounds maintenance | 2.0x - 3.5x | Contracted maintenance revenue values well above one-off installs |
| Pest control | 3.0x - 5.0x | Route density and recurring contracts drive premium pricing |
| Auto repair and collision | 2.0x - 3.5x | Real estate ownership often valued separately |
| Restaurants, independent | 1.5x - 2.5x | Lease terms and equipment condition dominate |
| Restaurants, established franchise | 2.0x - 3.5x | Franchisor approval of the buyer is a real deal risk |
| Physical retail | 1.5x - 3.0x | Inventory typically valued on top of the multiple |
| E-commerce and DTC | 2.5x - 4.0x | Channel concentration and paid-acquisition dependence cut the multiple |
| Wholesale and distribution | 2.5x - 3.5x | Supplier contracts and inventory turns matter more than growth |
| Light manufacturing | 2.5x - 4.0x | Add-back scrutiny is heavy; capex needs are checked closely |
| Professional services (accounting, engineering) | 2.5x - 4.0x | Client retention through transition is the central question |
| Marketing and creative agencies | 2.0x - 3.5x | Retainer mix is the single biggest swing factor |
| IT managed services (MSP) | 3.0x - 5.0x | Contracted monthly recurring revenue is prized |
| Staffing and recruiting | 2.0x - 3.5x | Perm-heavy books value below contract-heavy books |
| Trucking and last-mile logistics | 2.0x - 3.5x | Owned fleet age and driver retention drive the range |
| Childcare and early education | 2.5x - 4.0x | Licensed capacity and enrollment waitlists support the top |
| Fitness and gyms | 2.0x - 3.0x | Membership churn and equipment refresh cycles weigh on value |
| Veterinary practices | 3.5x - 5.5x | Sustained consolidator demand keeps this above trade averages |
| Dental practices | 1.5x - 2.5x | Doctor-to-doctor sales; DSO buyers price on 4x to 7x adjusted EBITDA instead; cross-checked at 55% to 75% of collections |
| Medical and specialty clinics | 2.5x - 4.5x | Payer mix and provider non-competes are decisive |
| Property management | 3.0x - 5.0x | Doors under management is the operative unit |
| Home health and personal care | 2.5x - 4.0x | Licensing, reimbursement rates, and caregiver churn set the band |
If your business sits in one of these categories, the matching tool page carries the sector-specific model: home services, restaurants and hospitality, e-commerce and DTC, IT managed services, staffing, and healthcare services.
EBITDA multiples by industry in the lower middle market
Once a business has salaried management and roughly $1M or more of EBITDA, buyers switch metrics and the multiple steps up. Part of that step is real (bigger businesses are genuinely less risky), and part of it is competitive (private equity and strategic acquirers compete for deals that individual buyers cannot finance).
| Sector | Typical EBITDA multiple, $1M - $10M EBITDA | What drives the top of the range |
|---|---|---|
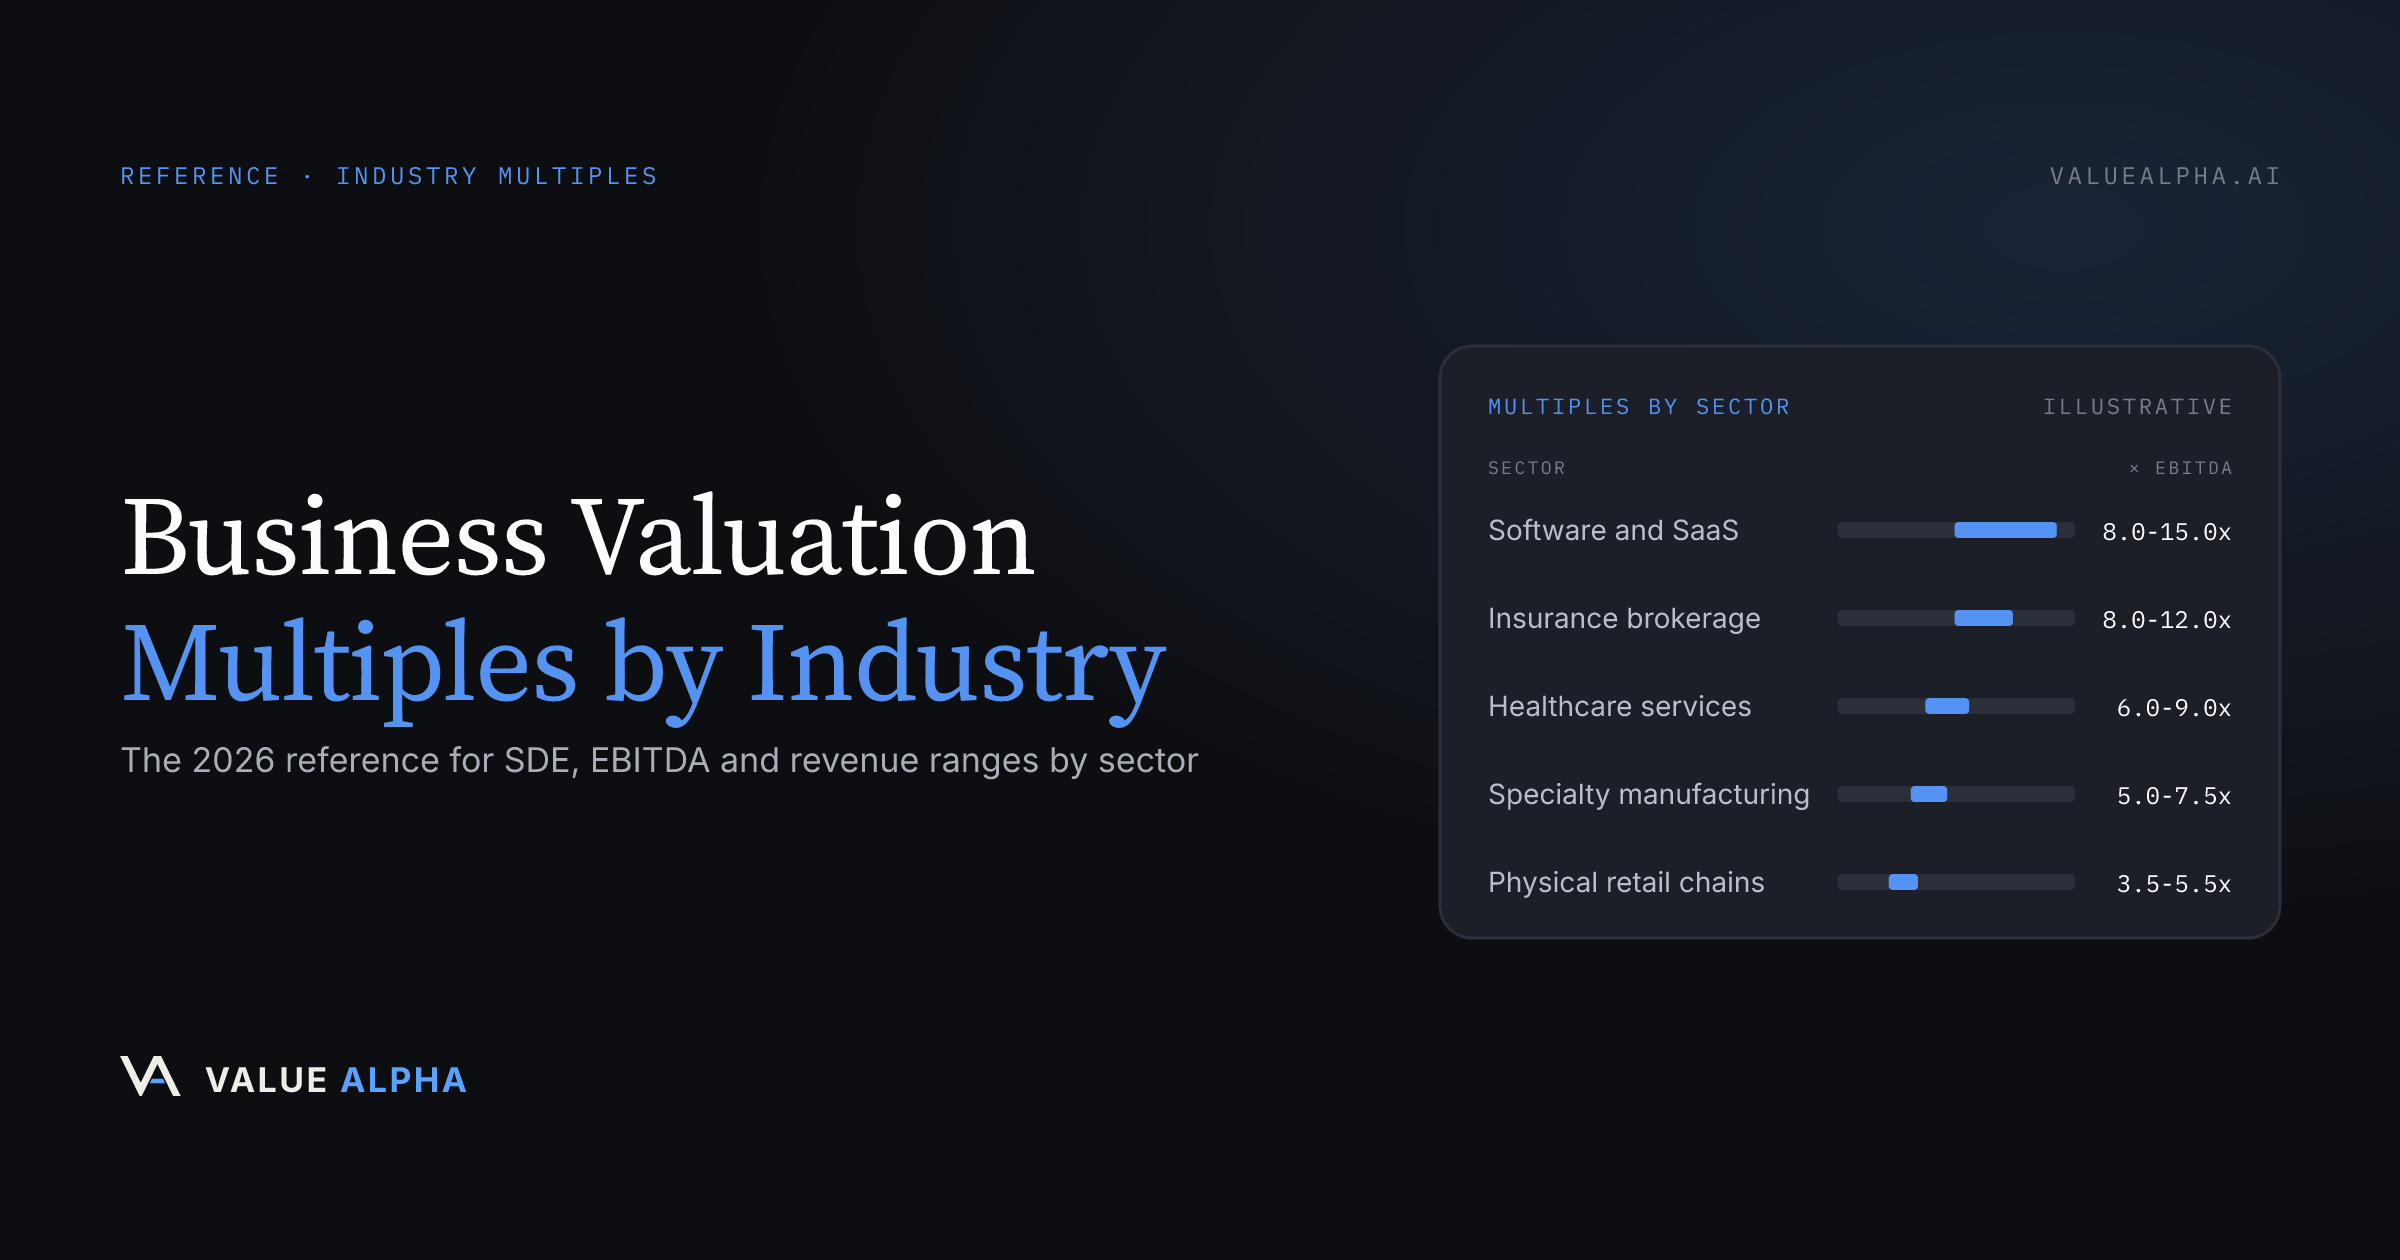
| Software and SaaS | 8.0x - 15.0x | Net revenue retention above 100%, low churn, gross margin above 75% |
| Insurance brokerage | 8.0x - 12.0x | Renewal retention, commission mix, carrier relationships |
| Wealth management and RIA | 7.0x - 11.0x | Recurring fee revenue, client age profile, advisor continuity |
| Healthcare services | 6.0x - 9.0x | Payer diversification, provider retention, multi-site scalability |
| Environmental and waste services | 6.0x - 9.0x | Permits, route density, long-term municipal contracts |
| Business and outsourced services | 5.0x - 7.5x | Contract length and switching costs |
| Specialty manufacturing | 5.0x - 7.5x | Proprietary product, sole-source positions, aftermarket revenue |
| Value-added distribution | 5.0x - 7.0x | Exclusive territories, technical service content |
| Equipment rental | 5.0x - 7.5x | Fleet age, utilization rate, replacement capex profile |
| Transportation and logistics | 4.5x - 6.5x | Dedicated contracts versus spot exposure |
| Media, marketing, and advertising | 5.0x - 7.0x | Retainer share of revenue, client tenure |
| Consumer products and brands | 4.5x - 7.0x | Brand strength, retailer concentration, margin durability |
| Construction and specialty trades | 4.0x - 6.0x | Backlog quality, bonding capacity, self-perform share |
| Restaurants, multi-unit | 4.0x - 6.5x | Unit economics consistency and remodel obligations |
| Physical retail chains | 3.5x - 5.5x | Lease portfolio and online exposure |
Sector-specific models sit on the matching tool pages for subscription SaaS, insurance brokerage, wealth management and RIA, industrial manufacturing, wholesale distribution, and logistics and transport.
How much does deal size change the multiple?
More than most owners expect. The same business, at the same margin, in the same sector, is worth a meaningfully higher multiple at $6M of EBITDA than at $1.5M. This is the size premium, and it is the most reliable pattern in private-company transaction data.
| Earnings band | Metric usually quoted | Typical multiple | Buyer pool |
|---|---|---|---|
| Under $250K | SDE | 1.5x - 2.5x | Individual owner-operators, local buyers |
| $250K - $500K | SDE | 2.0x - 3.0x | Individual buyers, SBA-financed |
| $500K - $1M | SDE | 2.5x - 4.0x | ETA and search fund buyers, SBA-financed |
| $1M - $3M | EBITDA | 4.5x - 6.0x | Independent sponsors, small funds, family offices |
| $3M - $5M | EBITDA | 5.5x - 7.0x | Lower-middle-market private equity |
| $5M - $10M | EBITDA | 6.5x - 8.5x | Established PE platforms, strategics |
| $10M - $25M | EBITDA | 7.5x - 9.5x | Middle-market PE, corporate acquirers |
Three forces create the pattern. Larger businesses carry less key-person risk because they have real management depth. They attract more bidders, and competition itself is worth a turn or more. And they support institutional debt on better terms, which lets buyers pay more for the same cash flow.
For ETA and search fund buyers, this table is also a strategy document: the gap between the $500K to $1M SDE band and the $3M to $5M EBITDA band is exactly the value created by a successful roll-up. Buying four businesses at 3x and operating them as one platform worth 6x is arithmetic before it is anything else.
When do revenue multiples make sense?
Revenue multiples are widely quoted and widely misused. They are legitimate in sectors where operating margins cluster tightly, because in those cases revenue is a reliable proxy for earnings. They are misleading everywhere else.
| Sector | Typical revenue multiple | Basis |
|---|---|---|
| SaaS, profitable, 20% - 30% growth | 3.0x - 6.0x | Annual recurring revenue |
| SaaS, slow growth or high churn | 1.5x - 3.0x | Annual recurring revenue |
| IT managed services | 1.0x - 2.0x | Contracted monthly recurring revenue, annualized |
| Insurance brokerage | 2.0x - 3.5x | Annual commissions and fees |
| Wealth management and RIA | 2.0x - 3.0x | Annual fee revenue |
| Dental practices | 0.55x - 0.75x | Annual collections |
| E-commerce and DTC | 0.5x - 1.5x | Trailing twelve-month revenue |
| Staffing and recruiting | 0.3x - 0.6x | Trailing twelve-month revenue |
| Trucking and logistics | 0.4x - 0.8x | Trailing twelve-month revenue |
| Restaurants | 0.3x - 0.5x | Trailing twelve-month revenue |
The rule: use a revenue multiple to check an earnings-based answer, never to replace it. If your SDE multiple and your revenue multiple disagree badly, the useful signal is usually that your margins are unusual for the sector, which is itself the thing a buyer will ask about.
What moves your multiple inside the range?
The published range is the sector. Your position within it is the business. These are the factors that reliably move the number in a negotiation, with the adjustment sizes typically seen in the lower middle market.
| Factor | Typical effect on the multiple |
|---|---|
| Recurring or contracted revenue above 50% of sales | +0.5x to +1.5x |
| Management team that runs the business without the owner | +0.5x to +1.0x |
| Sustained revenue growth above 15% per year | +0.5x to +1.0x |
| Reviewed or audited financials, quality of earnings ready | +0.25x to +0.75x |
| Gross margins above the sector norm | +0.25x to +1.0x |
| Largest customer above 25% of revenue | -0.5x to -1.5x |
| Owner personally holds the key relationships or licenses | -0.5x to -1.5x |
| Declining revenue over the trailing two years | -0.5x to -2.0x |
| Deferred maintenance or a capex catch-up requirement | -0.25x to -1.0x |
| Messy books, cash transactions, or unsupported add-backs | -0.5x to -1.5x |
Two of these deserve special attention because they are the ones most often underestimated by sellers. Customer concentration is treated as an existential risk by buyers rather than a discount item, and we cover the mechanics in customer concentration and business value. Add-backs are the other: aggressive owner add-backs that do not survive diligence do more than reduce earnings, they damage the buyer's trust in every other number in the file. Add-backs explained covers which ones hold up.
Where do these multiples come from?
Credible multiples come from completed transactions, not asking prices. The primary sources professional appraisers and M&A advisors rely on:
- DealStats (formerly Pratt's Stats), published by Business Valuation Resources, is the deepest database of closed private-company transactions with reported financial detail, and it is the backbone of most market-approach analyses.
- IBBA and M&A Source Market Pulse, a quarterly survey of business brokers and M&A advisors, reports median multiples by deal size band for Main Street and lower-middle-market transactions. It is the best read on what is actually clearing in the sub-$50M market.
- GF Data covers private-equity-backed transactions with enterprise values above roughly $10M and is the standard reference for lower-middle-market EBITDA multiples and leverage.
- BVR's Guideline Public Company data and industry benchmarks support the public-comparables side of the market approach, with size and marketability adjustments applied.
- IRS Revenue Ruling 59-60 remains the framework that defines what a valuation must consider for federal tax purposes, and it is still the reference point for the standard of value in most appraisal work.
- SBA SOP 50 10 governs what an acquisition valuation must look like when the deal is SBA-financed, which covers a large share of sub-$5M transactions. Our SBA 7(a) valuation requirements guide covers the $250,000 independent appraisal threshold in detail.
Three cautions when reading any published table, including this one. First, medians hide enormous dispersion: the businesses at the top of a sector range and the ones at the bottom are not the same businesses. Second, check whether a quoted multiple is on SDE or EBITDA and whether it includes inventory and real estate, because those conventions vary by source and by sector, and mixing them is how a valuation ends up two times off. Third, ask which companies are in the denominator. Public-company sector averages usually include loss-making firms, and because a negative EBITDA shrinks the denominator, the all-firm figure runs above what the profitable companies in the same sector trade at: in the January 2025 Damodaran data, biotech reads 15.8x on profitable firms and 51.5x on all of them, and even outside biotech the gap runs 13% to 30%. A profitable private business should be benchmarked against profitable companies.
How to apply a multiple correctly
- Normalize the earnings first. Recast the P&L to remove owner perks, one-time items, and non-operating expenses. The multiple is worthless if the earnings figure underneath it is not defensible.
- Pick the right metric for the size. Use SDE if a working owner is central, EBITDA if salaried management runs the business. Do not mix them.
- Start at the sector midpoint, not the top. Owners anchor on the high end of published ranges; buyers anchor on the low end. The midpoint is the honest starting position.
- Apply the factor adjustments explicitly. Write down each premium and discount from the table above with a reason. This is what makes the number survive a negotiation.
- Cross-check against a second method. A discounted cash flow analysis and an asset floor should bracket the multiple-based answer. When they do not, one of your assumptions is wrong. How to value a business walks through the full reconciliation.
- Convert enterprise value to equity value. Subtract interest-bearing debt, add excess cash, and settle the working capital peg. This bridge routinely moves the seller's actual proceeds by six figures.
- State the result as a range. A single number implies a precision that does not exist. See why your business valuation is a range.
Common mistakes with industry multiples
Applying an EBITDA multiple to SDE. A business with $600,000 of SDE is not worth 6x, or $3.6M. Convert to EBITDA by deducting a market-rate manager salary first, then apply the appropriate multiple, or stay in SDE and use an SDE multiple.
Using a public-company multiple for a private business. Public comparables trade with liquidity, scale, audited financials, and analyst coverage that a $3M-revenue business does not have. Private companies of similar profile transact well below public multiples.
Treating the multiple as the negotiation. Buyers negotiate structure as much as price. A 5x headline with half the consideration in an earnout is not 5x. Deal terms, escrow, and seller financing all change what the multiple actually pays.
Ignoring what a quality of earnings review will do. Buyer-side diligence commonly reduces reported earnings, and since the multiple applies to the reduced figure, the effect on price is amplified. Quality of earnings vs valuation covers what typically gets adjusted.
Reading last year's data as this year's market. Multiples move with credit conditions and buyer appetite. Any table, this one included, is a snapshot that needs to be checked against current transaction data before you rely on it for a real deal.
Key Takeaways
- The metric depends on size. SDE multiples of roughly 2x to 4x for owner-operated businesses; EBITDA multiples of roughly 4x to 9x once salaried management is in place. Mixing the two is the most expensive common error in small-business valuation.
- The size premium is real and large. The same business at $5M of EBITDA typically earns two to three additional turns over its $1M counterpart, driven by management depth, buyer competition, and access to institutional debt.
- Sector sets the range; the business sets the position. Recurring revenue, management depth, growth, and clean books push toward the top. Customer concentration, owner dependence, and decline push toward the bottom.
- Revenue multiples are a cross-check, not an answer. They only work where margins cluster tightly, and even then earnings-based methods should carry the weight.
- Cite completed transactions, not asking prices. DealStats, IBBA Market Pulse, and GF Data are the credible sources; broker listing prices are not data.
- Most of the discount is fixable. Concentration, owner dependence, and financial hygiene are the three biggest value gaps, and each of them responds to twelve to twenty-four months of deliberate work before a sale.
Putting it to work
A multiple table tells you the neighborhood. It does not tell you the house. The distance between the bottom and the top of any sector range in this reference is often a doubling of value, and that distance is determined entirely by the specific facts of one business: who the customers are, who runs it, how the revenue repeats, and whether the numbers hold up under scrutiny.
ValueAlpha runs a full valuation on your own financials rather than a sector average, applying the income, market, and asset approaches side by side and showing exactly which factors moved your multiple within the range. Upload your statements and the model reconciles the three methods into a documented range with the assumptions visible. For a first pass on what to expect, how much is my business worth covers the ballpark; when you are preparing for a real transaction, preparing your business for valuation covers the work that actually moves the number.
Frequently Asked Questions
What is the average business valuation multiple?
What is a good EBITDA multiple for a small business?
Which industries get the highest valuation multiples?
Should I use an SDE multiple or an EBITDA multiple?
Do revenue multiples work for valuing a small business?
Where do published valuation multiples actually come from?
Why does my business qualify for a lower multiple than the published range?
Are valuation multiples applied to enterprise value or equity value?
ValueAlpha Team
Finance & AI Experts
MBA-trained valuation professionals and engineers building the future of private company valuation. We combine institutional finance methodologies with AI to make defensible valuations accessible to every business owner.
LinkedInRelated Guides
How-To
How to Value a Business: A Step-by-Step Guide
A practical, step-by-step guide to valuing a business: recast the financials, pick the right methods, run DCF, comps, and the asset floor, then reconcile into a defensible range.
Reference
SBA 7(a) Business Valuation Requirements: The Complete 2026 Guide
Everything ETA buyers and sellers need to know about SBA 7(a) business valuation requirements under SOP 50 10 8 - the $250,000 independent appraisal threshold, who qualifies to perform the valuation, accepted methods, costs, and timelines.